 "Great Britain Box" by Prokofiev - Own work. Licensed under CC BY-SA 3.0 via Wikimedia Commons.
Inspired by the Introduction to Complexity course and the unit on Factals, I though it would be fun to make a rough calculation of the fractal dimension of the Greek coastline using the box counting method.
The box counting method goes as follows:
- Split the 2D map that depicts the coastline into squares (boxes) of a certain side size (r) and count the number of boxes (n) that include the coastline.
- Decrease the size of the boxes and go to step 1.
- When finished for a series of box sizes do a linear regression of log(n) given log(1/r).
- The slope of the line fitting the points on the plot is the fractal dimension of the object.
For a map of Greece, I used the one from
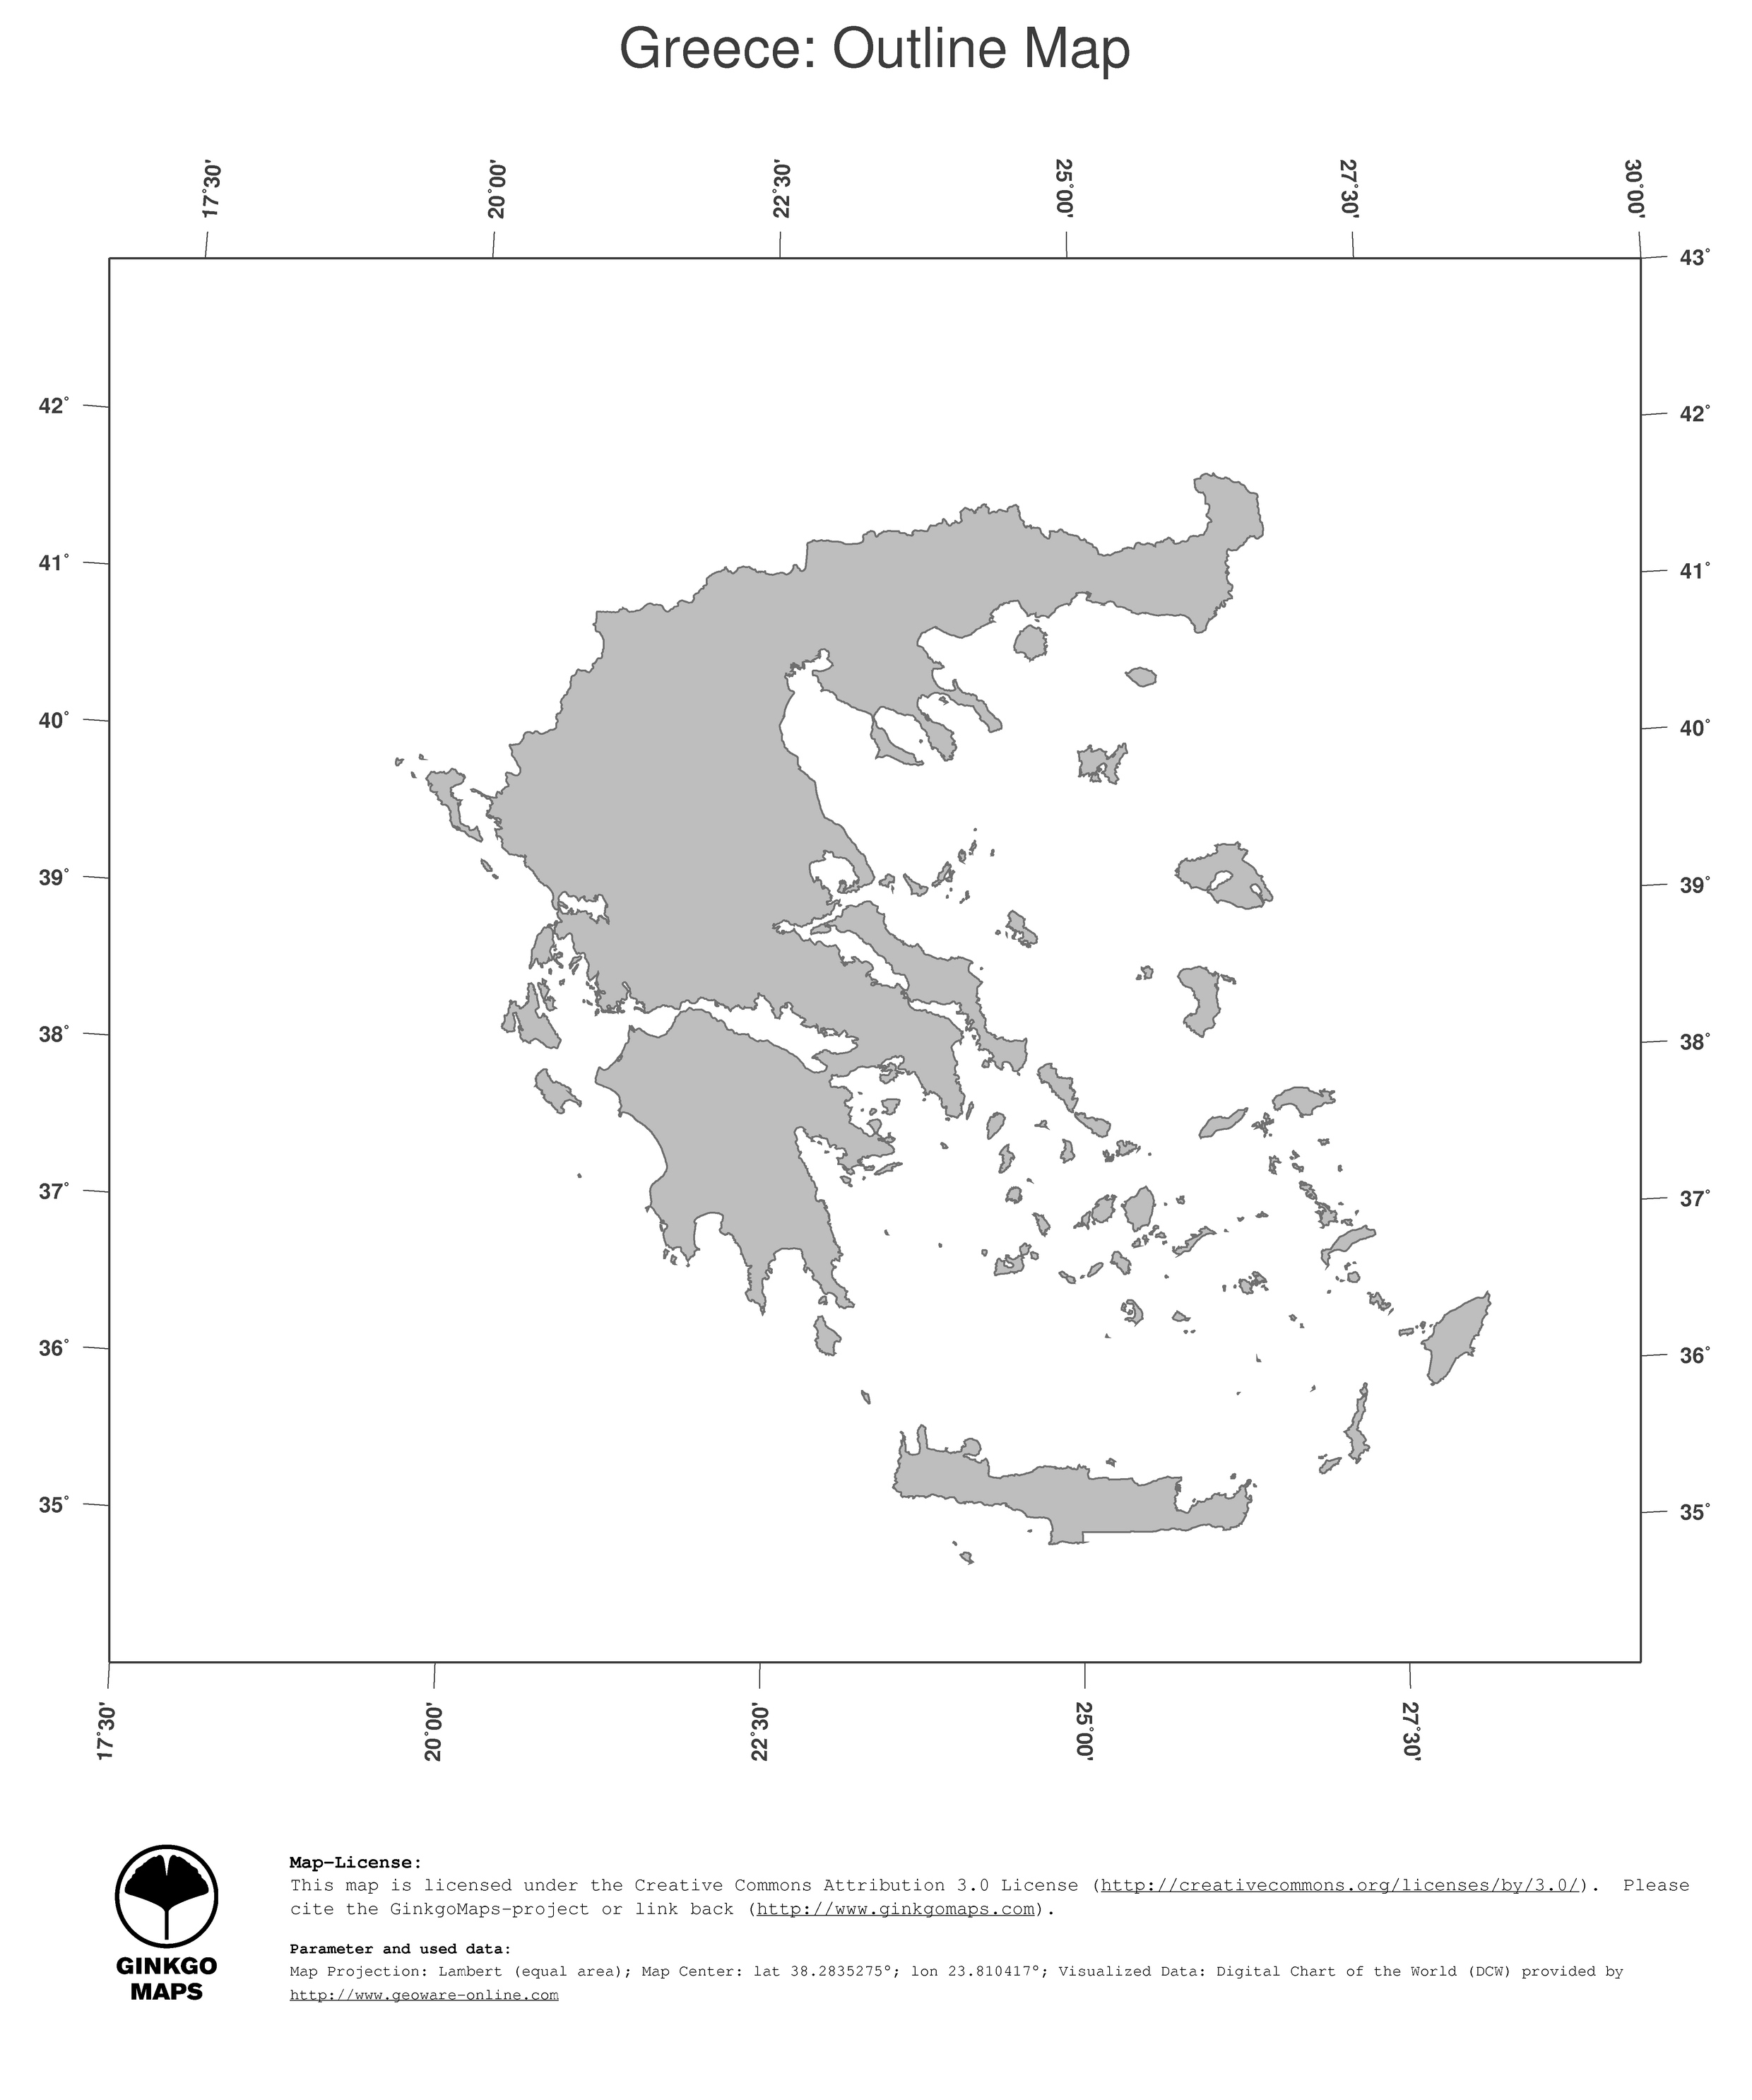
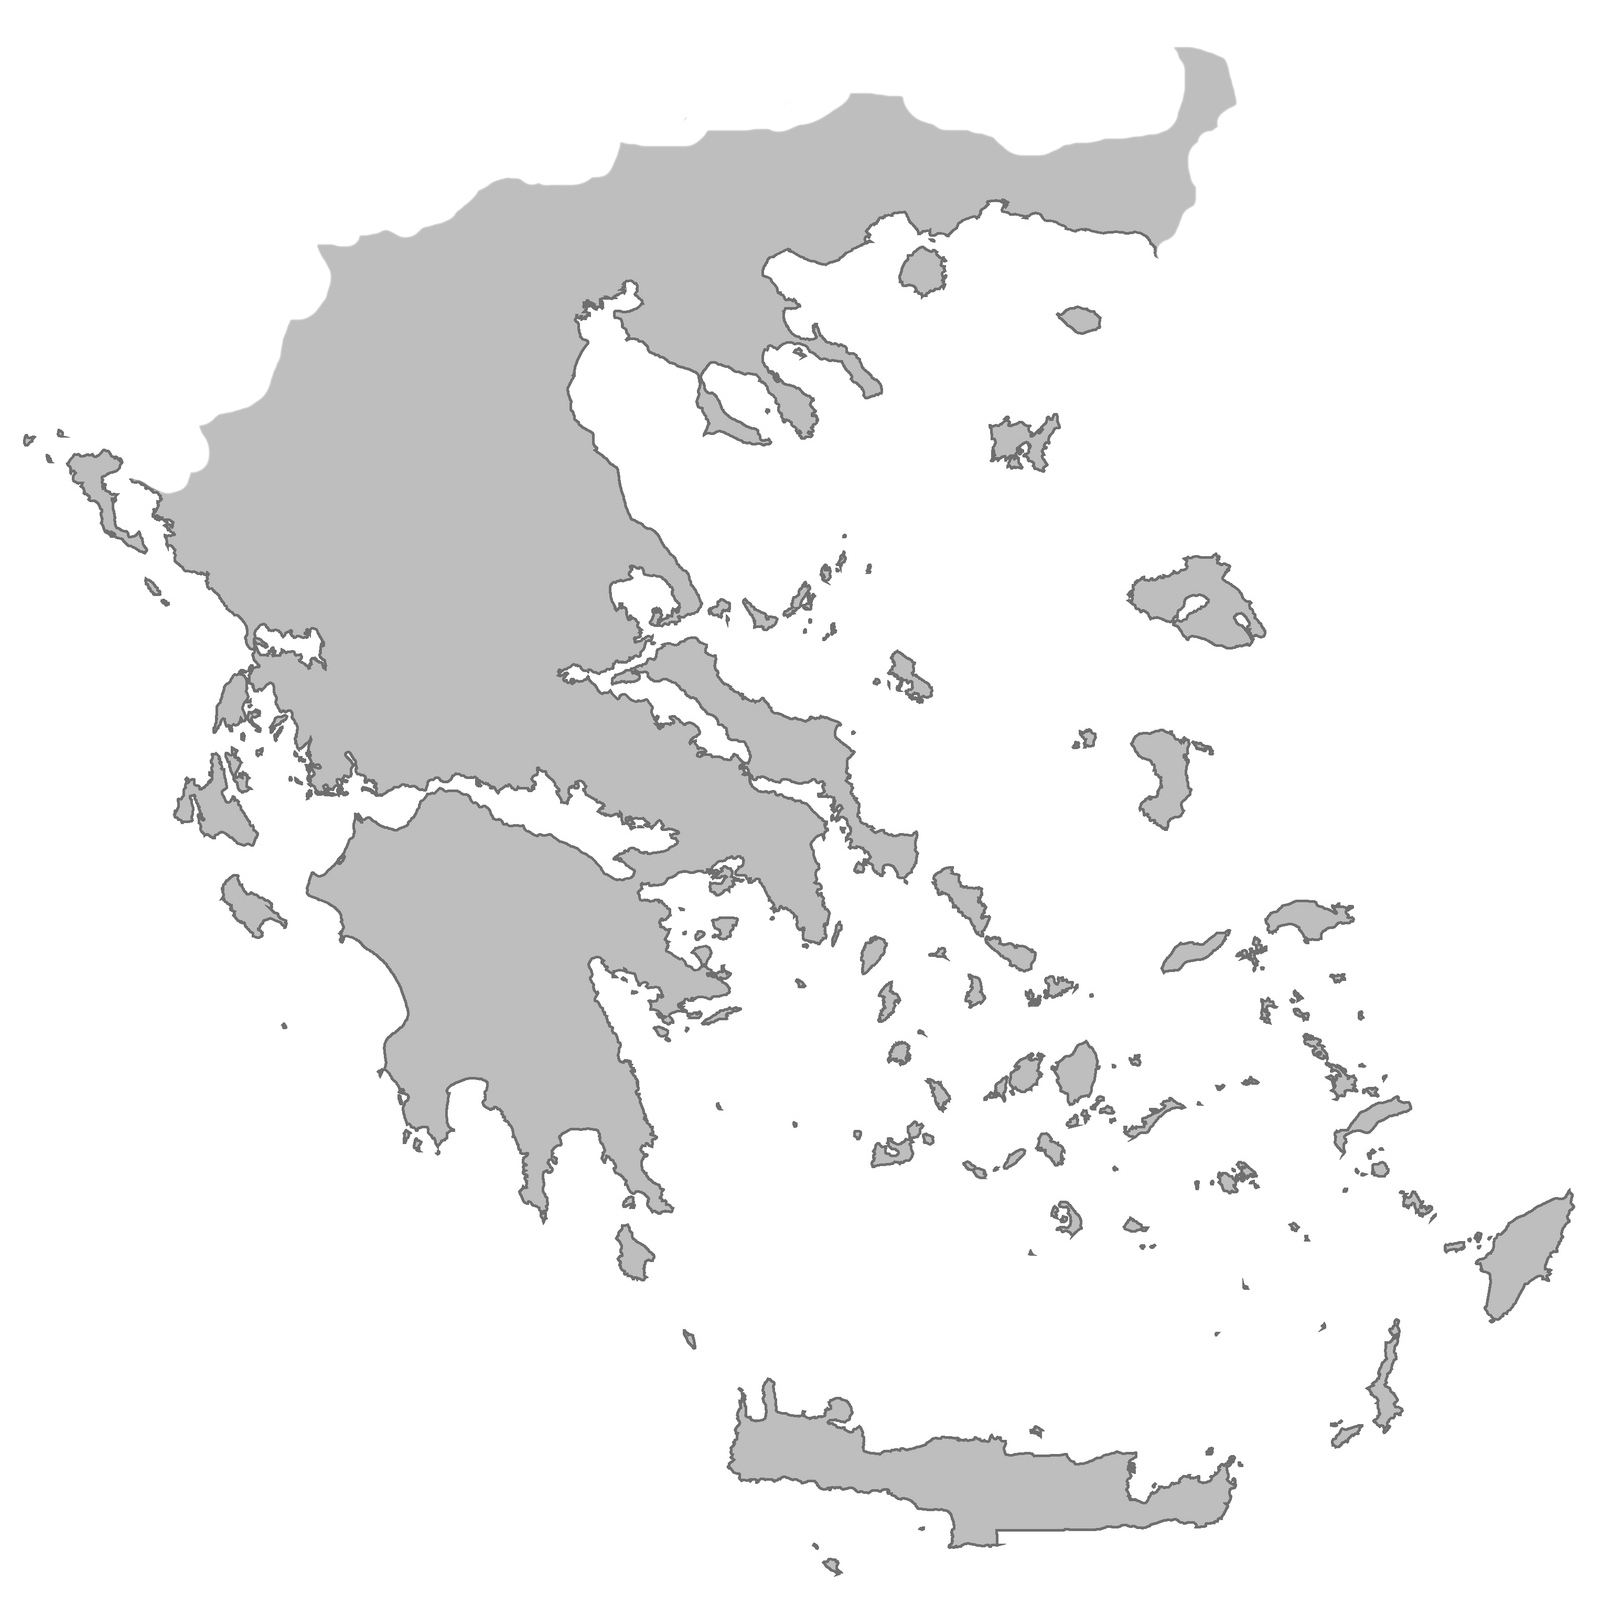
Ginko maps licensed under the Creative Commons Attribution 3.0. Via an image editor, I removed the frame with the infobox and geolocation axes, plus the borders not residing by the sea to facilitate further image processing. The retouched image was cropped to 1600×1600 pixels. Both images are shown below.
Original map

Retouched map

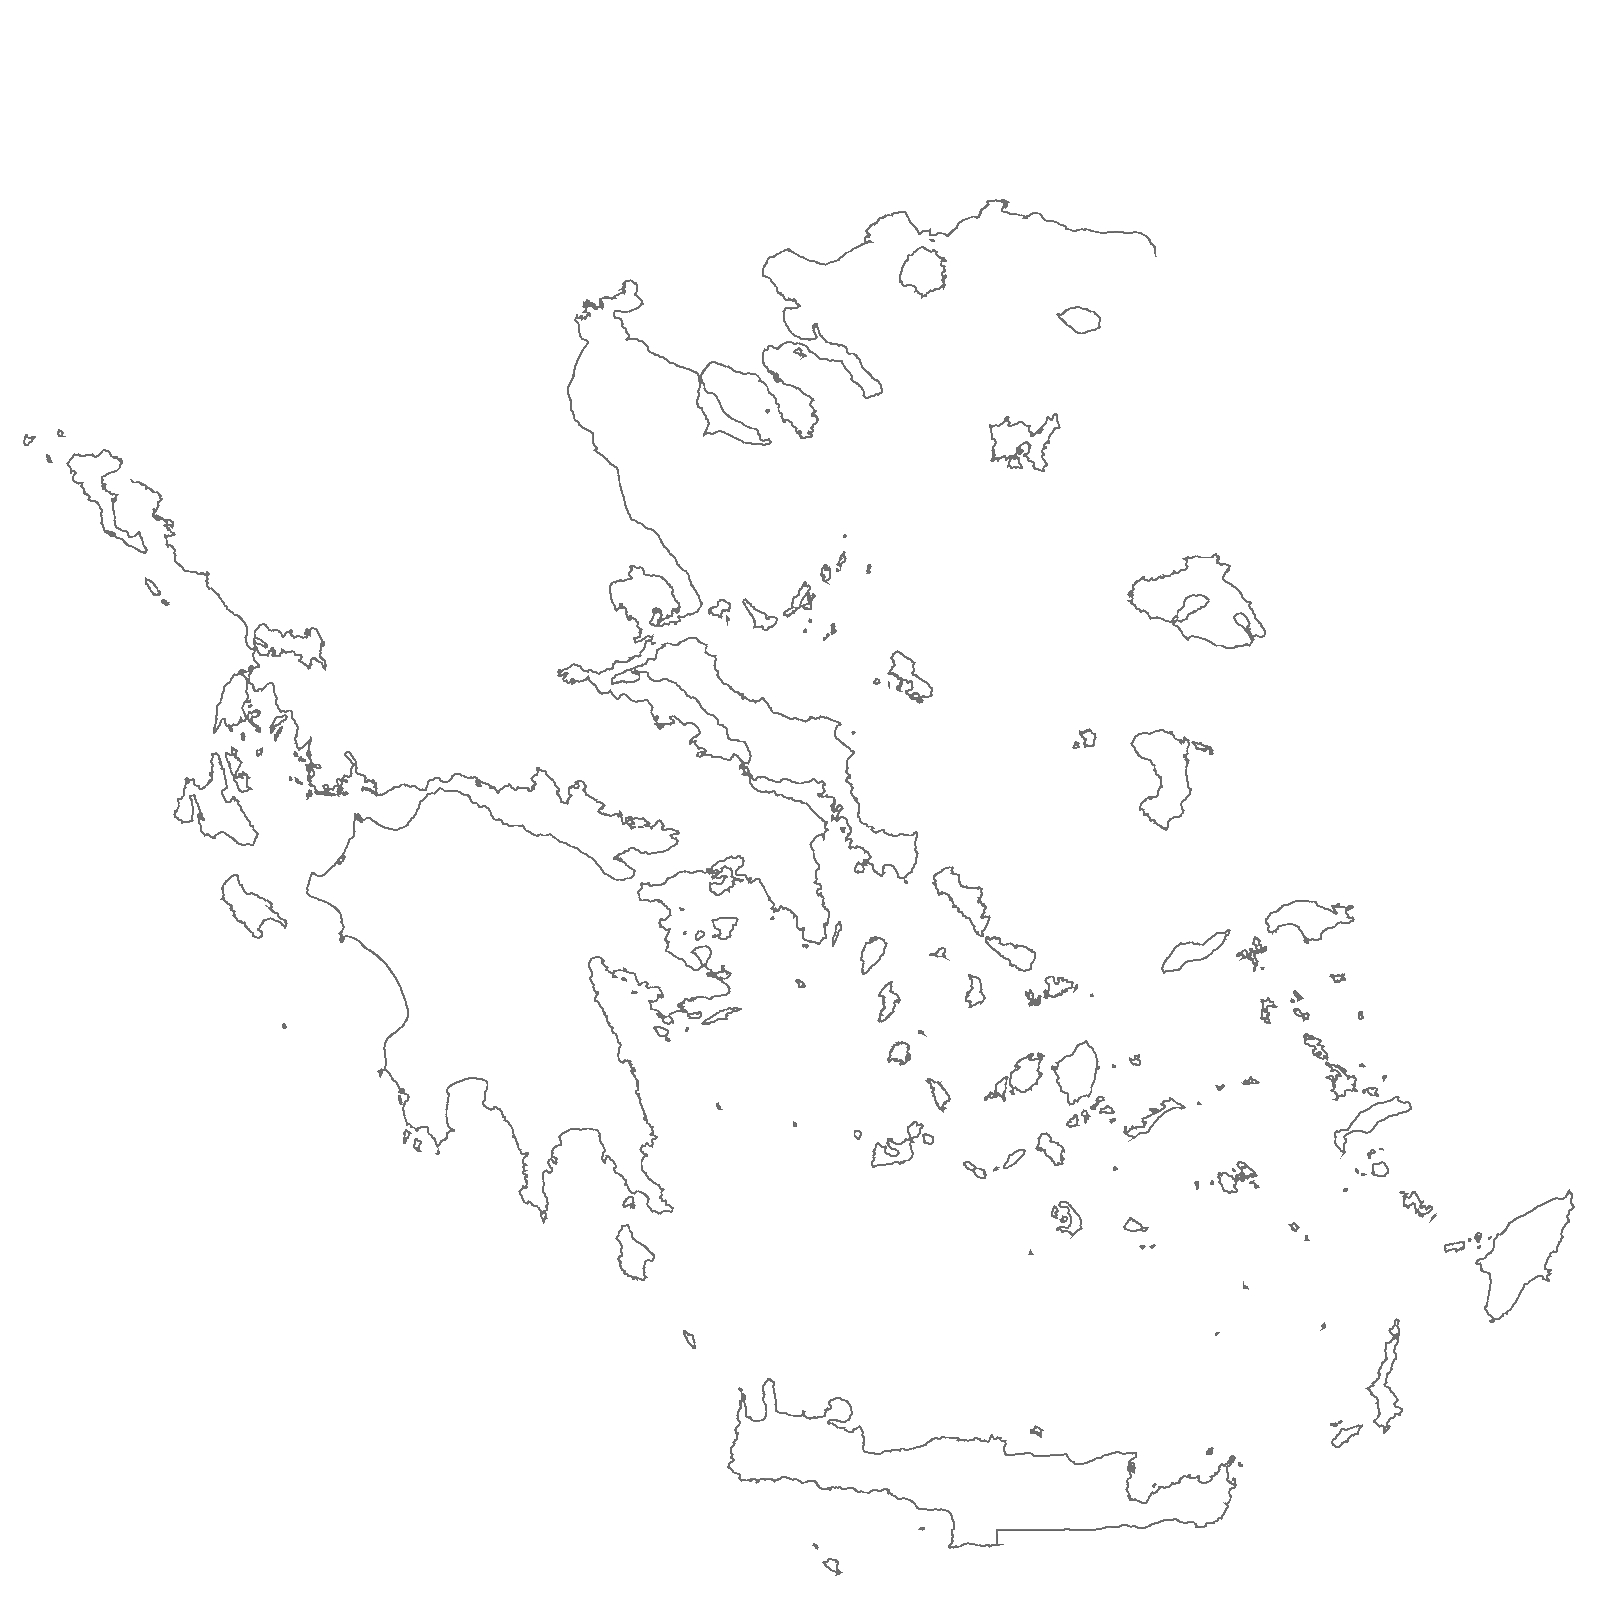
The R script below implements the box counting method on the coastline jpeg picture (make all values > 0.5 white) using boxes with sides that are divisors of 1600.
The coastline map

The R script
    library(jpeg)
    rm(list=ls())
    img = readJPEG("coastline.jpeg")
    # filter out mainland
    img[img > 0.5] = 1
    # divisors of 1600
    # 1,2,4,5,8,10,16,20,25,32,40,50,64,80,100,160,200,320,400,800,1600
    boxSizes = c(50, 40, 32, 25, 20, 16, 10, 8, 5, 4)
    h = img[,,1]
    data = data.frame()
    for(k in 1:length(boxSizes)) {
      b = boxSizes[k]
      x = dim(img[,,1])[1]
      ratio = x/b
      # https://stat.ethz.ch/pipermail/r-help/2012-February/303163.html
      k = kronecker(matrix(1:(ratio^2), ratio, byrow = TRUE), matrix(1,b,b))
      g = lapply(split(h,k), matrix, nr = b)
      counter = 0;
      for(i in 1:length(g)) {
        counter = counter + any(g[[i]] < 0.999)
      }
      data = rbind(data,c(log(counter),log(1/b)))
    }
    names(data) = c("Y", "X")
    model = lm(Y~., data=data)
    cat(coef(model), "\n")
The plot

With this rough approximation, the calculation yielded that the fractal dimension of the Greek coastline is 1.25. Great Britain’s was measured to be 1.25 and Norway’s 1.52 [source].
 Hi! My name is Kyriakos Chatzidimitriou, I am an Intelligent Systems, Data and Software Engineer. This is my website.


Comments